How to get ETF exposure to the ASX 200
An exploration of popular ASX 200 ETFs by comparing IOZ, STW and an equal weighted option.

ETFs have been rising in popularity due to their ease of access and the ability to diversify in a single trade. Anyone with a brokerage account can access hundreds of securities across different asset classes in one trade. The 2023 ASX Investor Study showed that the number of Aussie investors using ETFs has risen from 15% to 20% in the space of 3 years. It is particularly popular with new investors – ETFs were the first investment for 14% of investors who got started in the last two years.
The rise in popularity has led to product providers creating almost identical products to compete for the new funds entering the market. This often complicates the decision-making process for new investors – how do I choose between two investments that look exactly alike?
A good example of this choice is for large cap Australian equity exposure. The SPDR S&P/ASX 200 ETF (ASX: STW) and the iShares Core S&P/ASX 200 ETF (ASX: IOZ) both tracking the S&P/ASX 200 index.
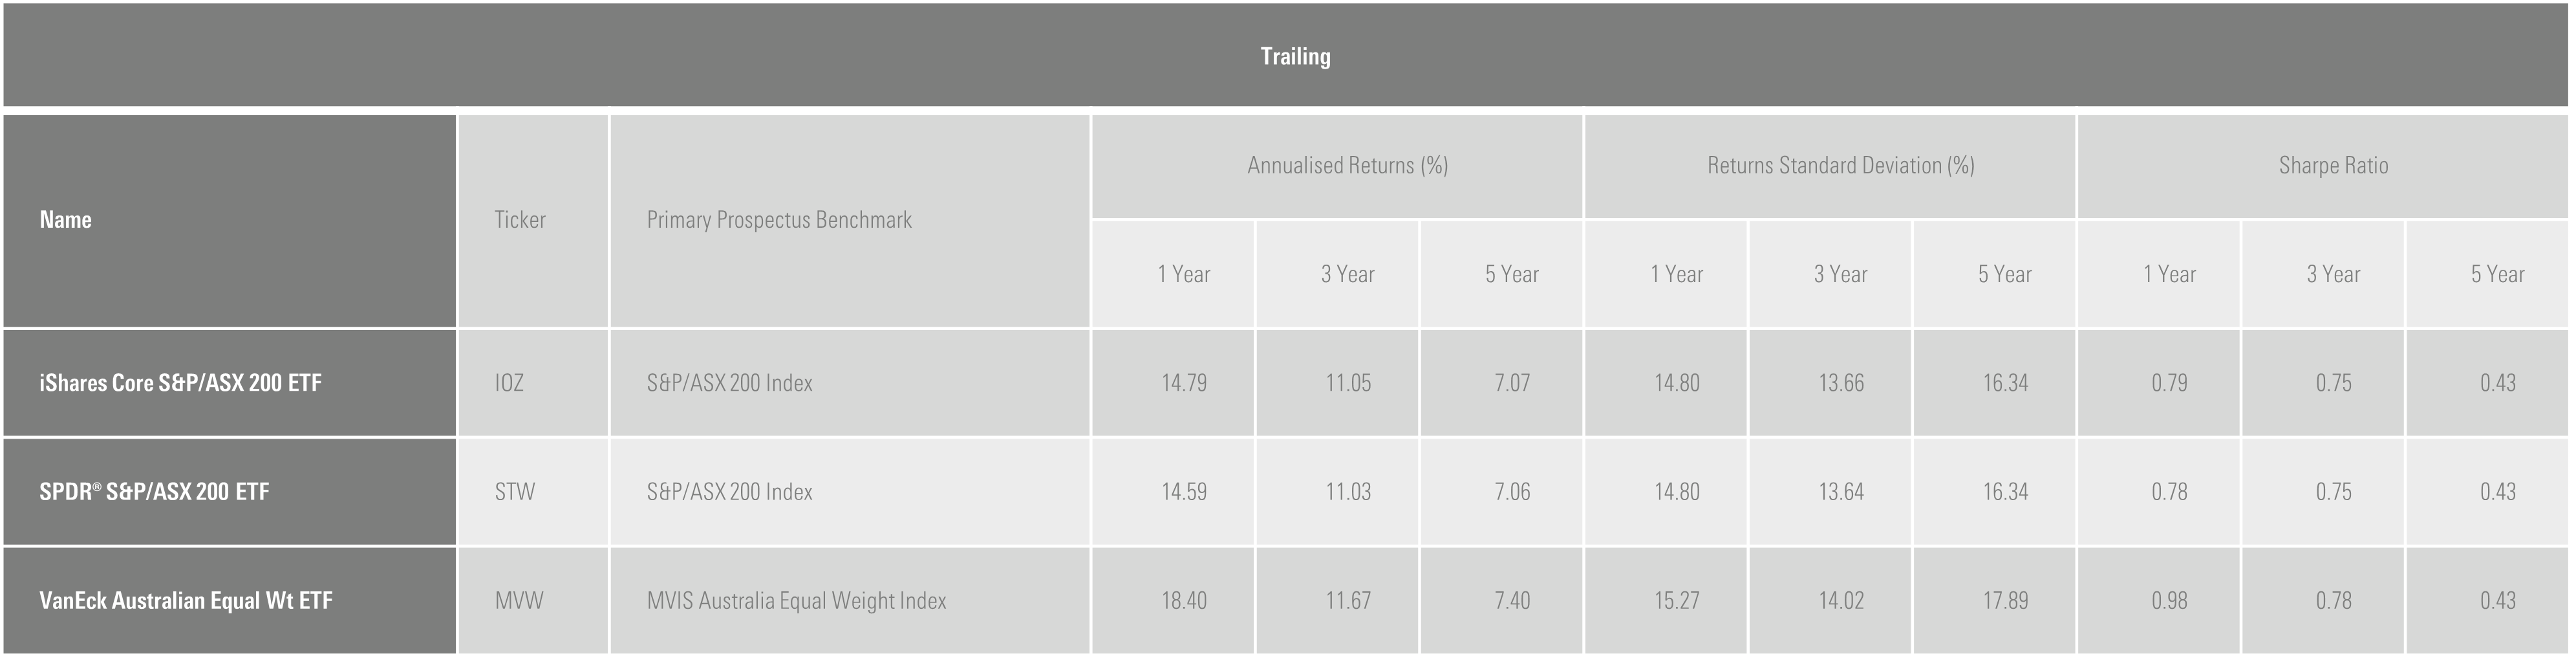
*at July 2023
At face value, the comparison shows that there’s not much difference between the two investment products apart from cost. Zunjar Sanzgiri, Senior Manager Research Analyst who covers both ETFs agrees. "From the portfolio perspective, the difference between the two indexes is minimal. Both the ETFs have an objective to replicate the performance of the same underlying index, S&P ASX 200, by closely matching the benchmark exposures."
He adds that this is the case because of the S&P ASX 200 index’s characteristics – it is simple, liquid and market weighted. Due to these factors, you don’t expect to observe significant differences in the implementation of the strategy. In case of ASX: IOZ and ASX: STW, the providers are BlackRock (iShares) and State Street (SPDR), respectively – their size, legacy, and experience in index-tracking products enables them to achieve seamless outcomes.
Comparing ETFs tracking the same index
When asked about how to objectively compare two products tracking the same index, the key metrics that Sanzgiri points to are:
- Tracking error, which measures the deviation of the ETF performance relative to the benchmark,
- Buy/Sell spread, which measures the costs experienced by investors when transacting in the ETF units, and
- Fees, which is the most predictable and transparent detractor from investor returns.
A potential alternative
One consideration when looking for broad domestic equity Australia are the unique attributes of the Australian market. BHP Group (ASX: BHP) makes up 10% of the index, and the top 10 holdings make up 46% of the index. The Australian market is very narrow, which means that a handful of sectors and industries dominate, including financial services and mining.
The result of this is inadequate diversification. An answer to this could be an equal-weighted ETF which invests proportionately across the holdings in the ETF. The VanEck Australian Equal Weight ETF (ASX: MVW) achieves this across 80 holdings that represent large and mid-cap shares in Australia. The fee is significantly higher than ASX: STW and ASX: IOZ at 0.35%, but our analysts believe this is justified.
They award ASX: MVW a Silver Medalist rating and think it is a great way to get exposure to the Australian market because it is more diversified.
Although past performance isn’t an indicator of future performance, the difference in fees and holdings can be seen in the trailing period performance for the three investment products.
The implications of market-weighted vs equal-weighted investments
A market cap weighted index like the ASX 200 or 300 allocates more to the biggest companies. In a market like Australia that is top heavy that means that a disproportionate amount goes to them. The average market cap of the equal weighted ETF portfolio is less than half that of the market cap weighted products. That gives you more exposure to medium sized companies and that diversifies the overall portfolio since so many of the biggest companies in Australia are banks and miners.
The exposure to the financials sector drops around 8% from over 28% for ASX: STW to 20% in ASX:MVW. And while the allocation to miners is not as large, you are getting more exposure to some smaller miners rather than just the biggest ones in the industry where half your basic materials allocation is to BHP.
Sanzgiri adds that the equal-weighted methodology does have some trade-offs. To keep the allocation equal weighted, the portfolio is rebalanced on a quarterly basis. This means that the turnover for equal-weighted strategies is generally higher than the market-weighted counterparts. This can add to the ETF costs. Investors should also be aware that equal-weighting results in a mid-cap bias in this scenario due to the underweighting of the largest stocks in the S&P ASX 200 index.
Overall, Sanzgiri declares that, for Australian equity market exposure, the benefits of the equal-weight methodology more than compensate for its limitations. Thus, ASX: MVW carries a Silver Medalist Rating, a notch above its peers tracking the standard S&P/ASX 200 Index.
Ever wanted to simplify your portfolio? Morningstar’s Investing Compass episode on building a 3 ETF portfolio covers ASX: MVW in depth.