US inflation still too hot for the Fed
The US Federal Reserve is still likely to raise rates in May despite the lowest inflation reading in two years.
The US Consumer Price Index report for March 2023 showed inflation chalking up its tamest increase in nearly two years, but upward pressure on prices continued at a pace that leaves the Federal Reserve on track to raise interest rates yet again next month.
Still, there was some good news to be had for consumers’ wallets. Much of the increase in inflation is now being driven by rents, which lag the rest of the economy and are widely expected to slow in coming months. Elsewhere, inflation pressures have stabilised, or even better, showing signs of disinflation—declining prices. Energy prices—including the prices paid at the gas pump—declined.
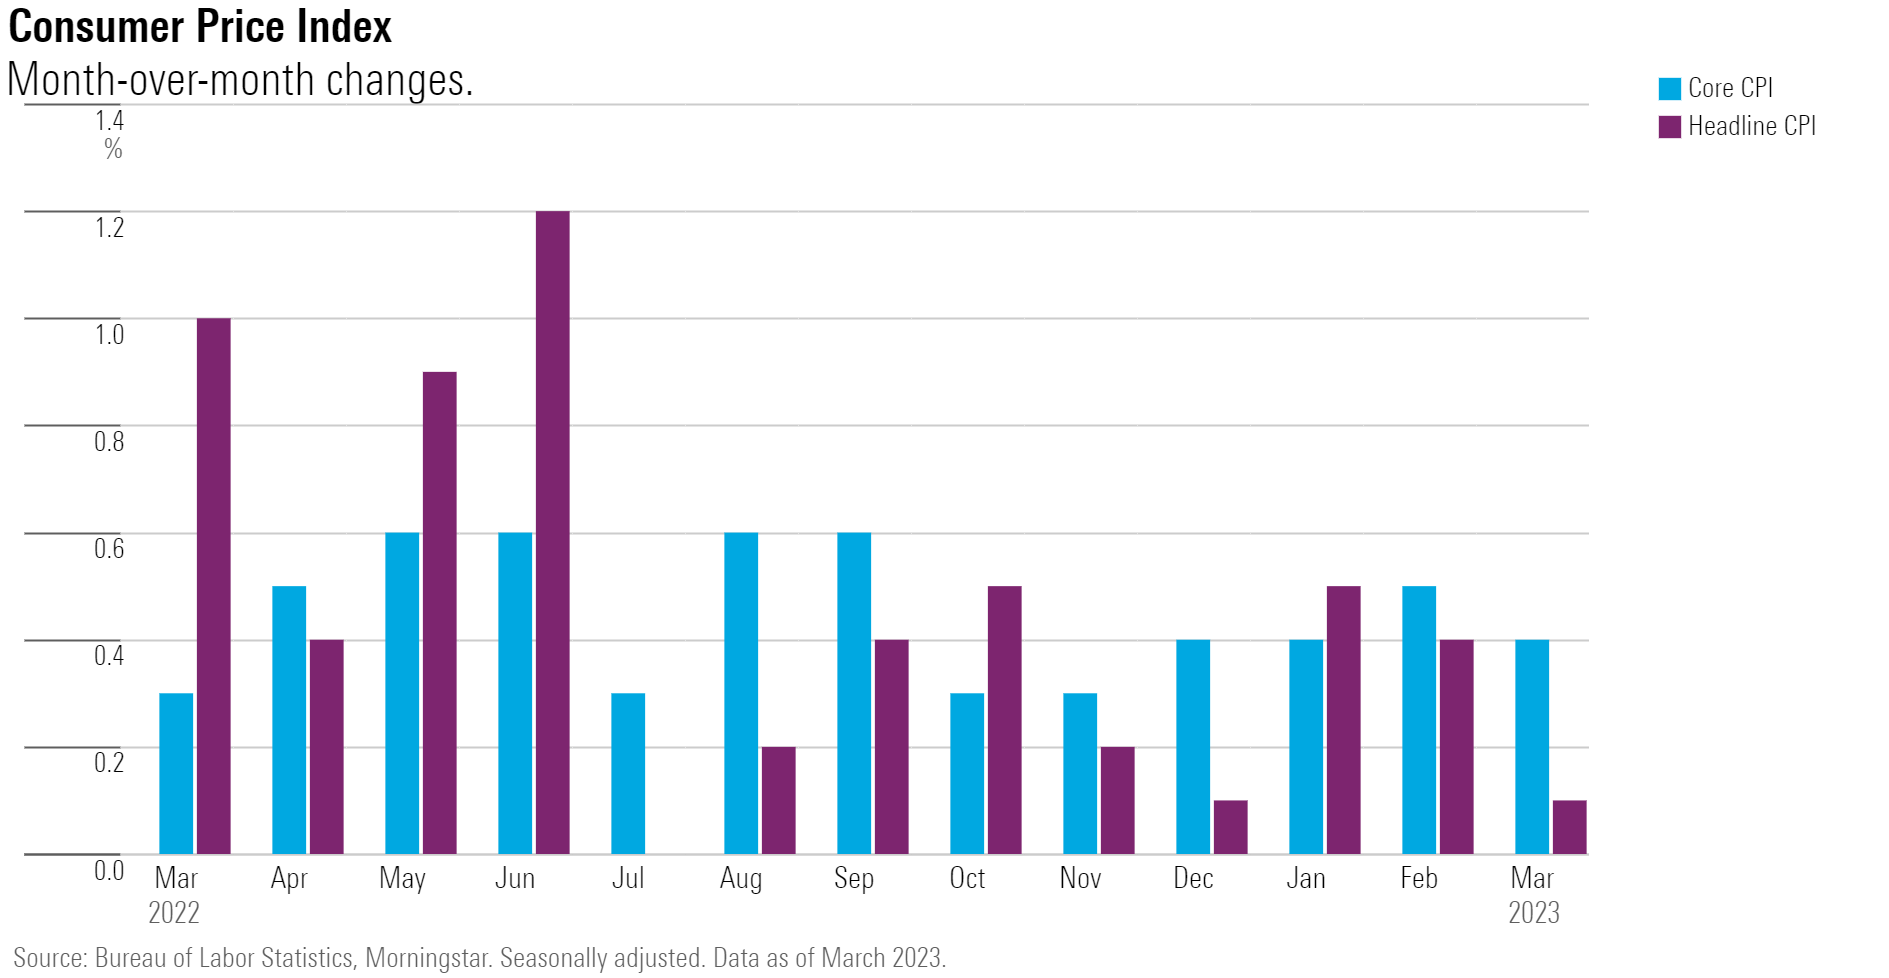
The Bureau of Labor Statistics reported an overall rise of 0.1% in the CPI for March. Meanwhile, core CPI, which excludes the volatile food and energy components, rose 0.4% in March.
“Today’s inflation report shows core inflation holding steady, more or less,” says Preston Caldwell, chief US economist at Morningstar.
However, “there’s still good reason to expect falling inflation on the horizon,” Caldwell adds, “but for now, the Fed is likely to hike rates again in May.”
March CPI Report Key Stats
- CPI rose 0.1% for the month versus 0.4% in February.
- Core CPI rose 0.4% after rising 0.5% in February.
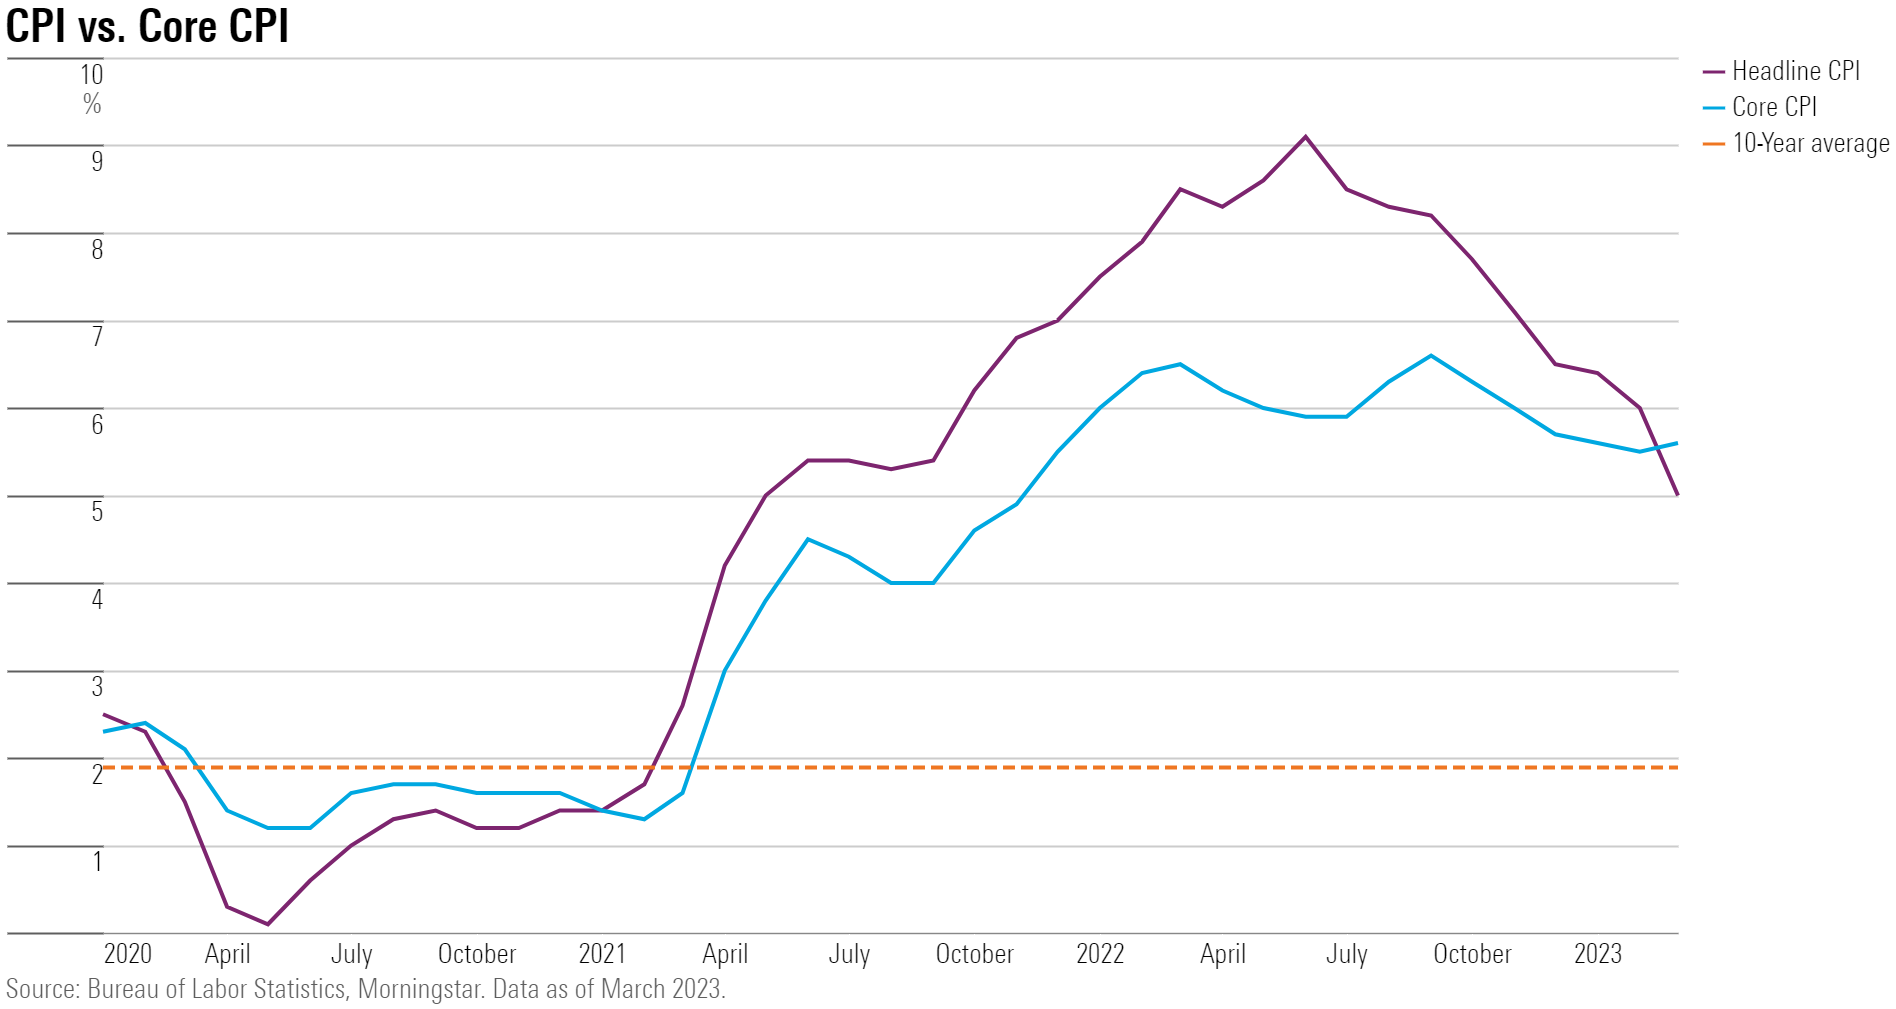
- CPI, year over year, rose 5.0% after rising 6.0% in February.
- Core CPI, year over year, rose 5.6% after rising 5.5% in February.
The March CPI increase of 0.1% came in lower than consensus estimates and marked an improvement from the 0.4% increase shown in the February CPI report. The lion’s share of the March CPI increase was driven by shelter costs, which more than offset an energy-price decline of 3.5% month over month. Food prices were unchanged in March overall, as restaurant prices rose 0.6%, but food at home prices fell 0.3%.
The 0.4% rise in core CPI was in line with economists’ forecasts. Notable price increases came from shelter, motor vehicle insurance, airline fares, and new vehicles. Prices for used cars and trucks as well as medical care decreased over the month.
When it came to year-over-year inflation rates, the CPI’s 5.0% rise in March was just below economists’ forecasts, but the 5.6% rise in core CPI matched expectations.
Interest-Rate Hike Expectations Strengthen
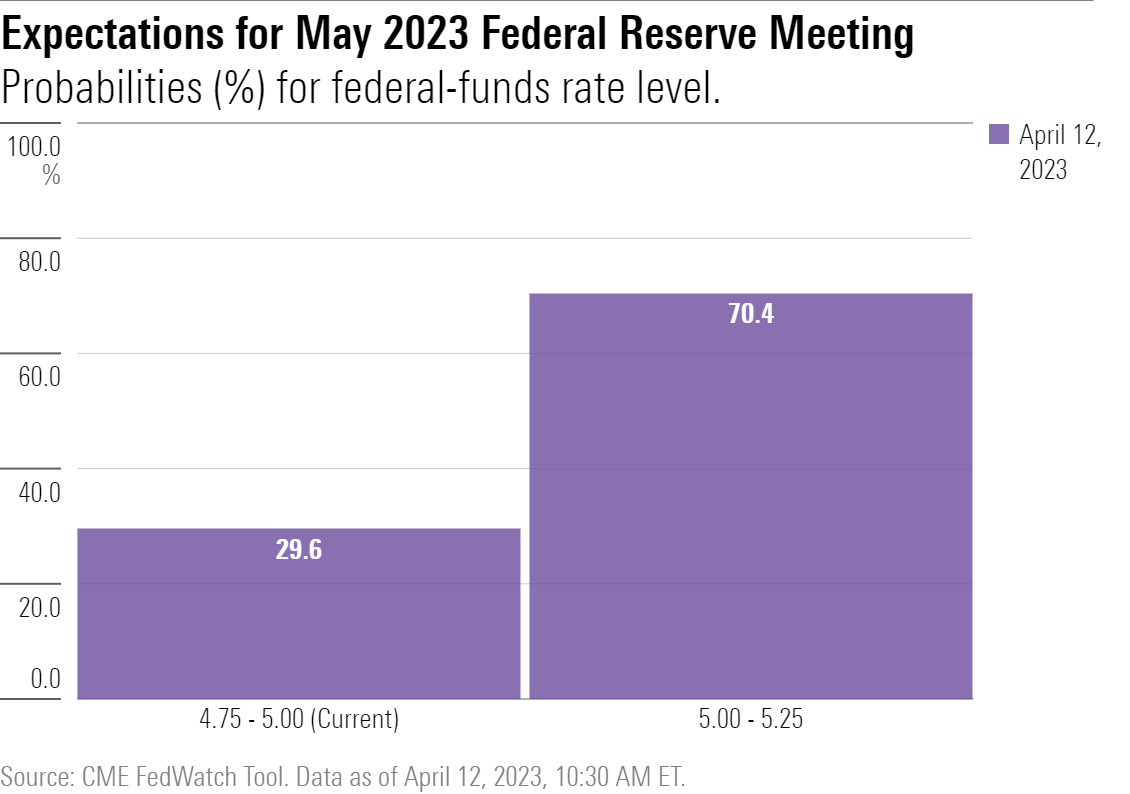
The great majority of market participants now expect the federal-funds effective rate target to rise 0.25% to a range of 5.00% to 5.25% at the Fed meeting on May 3, according to the CME FedWatch Tool. Remaining participants expect the Fed to keep the rate unchanged at its current target rate of 4.75% to 5.00%.
A week ago, prices suggested a roughly equal split in the futures market: half expected the Fed to hold rates unchanged at its May meeting, and half expected the target rate to rise by a quarter point. With the release of the March CPI report, 70.4% of futures market participants foresee the Fed raising its target rate by a quarter point.
Caldwell’s expectations for interest-rate hikes fall in line with market expectations: “After today’s report, we continue to think the Fed’s May meeting will result in another 0.25-point hike in the federal-funds rate,” he says.
Though inflation readings are an important part of the picture, much of the interest-rate debate now centers around financial stability concerns, Caldwell notes. “The dominant view at the Fed appears to be that it can prop up the banking system with liquidity injections, leaving it free to raise the federal-funds rate as needed to fight inflation.”
Caldwell says he’ll be closely watching the upcoming data on retail sales and other components of economic activity. “A sharp drop could signal that the Fed is at risk of overtightening.”
Further out, the majority of market participants now see the Fed pausing its rate hikes in June and either holding steady or beginning to lower rates thereafter. Caldwell’s forecasts match this view.