Local share prices offset housing malaise
Investor demand for Australian shares should continue amid ongoing support from low interest rates and other fundamentals, say economists from Commsec and AMP Capital.

Investor demand for Australian shares should continue amid ongoing support from low interest rates and other fundamentals, say economists from Commsec and AMP Capital.
Australia’s net household wealth grew in the first quarter of 2019, with a sharp rise in share prices offsetting the impact of falling property prices.
Shares could continue to gain through the remainder of 2019, helping to prop up household wealth, according to research from the Australian Bureau of Statistics.
Household net worth rose 0.2 per cent in the March quarter of 2019 to $10.2 trillion. A rebound in the Australian stock market drove the $147.8 billion increase in household wealth, recovering the $146.2 billion losses suffered in the previous quarter.
Over the year to March, net household worth fell by 0.7 per cent.
On a per capita basis, ABS figures indicate household wealth fell for a third consecutive quarter to $404,556, falling by $1,511.9. This follows a record $9,992.7 fall in household wealth per capita in the previous quarter, and reflects the continued fall in residential property values.
Total household wealth stabilised in the March quarter after the biggest fall in a decade in the December quarter of 2018, when both property and share prices fell.
“The Aussie share market is acting as a wealth ‘buffer’ against the property downturn. In the March quarter, the S&P/ASX200 index rose by 9.5 per cent – the strongest gain in 9 and a half years,” says Ryan Felsman, senior economist at Commsec.
He believes Aussie per capita wealth will consolidate around $400,000 over the medium term if home valuations continue to moderate, after significant gains over the past five years. "But property prices appear to have flattened in Sydney and Melbourne in June amid tentative signs of stabilisation."
Strong demand for Australian shares is likely to continue, as investors seek higher yields from shares as interest rates fall.
Fundamentals support share price strength
Alongside downward momentum on Australian interest rates, demand for Australian shares is being propped up by investors' desire for iron ore exposure, attractive dividend yields and solid payout ratios.
“The local share market’s relatively defensive composition when compared to its China supply-chain peer in Asia have made the ASX 200 an attractive proposition as the global search for yield re-intensifies,” Felsman says.
Debt burden growing
But there is trouble at home, with the mortgage debt to residential land and dwellings ratio increasing to 29 per cent in the March quarter of 2019, up from 28.1 per cent quarter-on-quarter.
This represents the largest quarterly increase since September quarter 2011, according to ABS figures.
Ongoing falls in residential property prices have been driving this ratio higher still, as the pace of mortgage debt growth has slowed the most since the September quarter of 2013.
Diana Mousina, an economist with AMP Capital, says household debt-to-income ratios are also at record highs in Australia compared to average incomes, and versus other comparable countries, as the chart below shows.
Mousina expects further falls in home prices across Australia until mid-2020, although recent data suggests the pace of falls is moderating.
Household debt to income ratio
Source: RBA, Bloomberg, AMP Capital
“We expect home prices to have a peak to trough fall of 15 per cent nationally, with falls in Sydney and Melbourne larger at around 25 per cent.
"This means around another 5 per cent fall in prices nationally and more in Sydney and Melbourne,” she says.
Aussie super-wealthy buck trend
However, further research indicates wealth levels among Australian rich-listers are holding up better than might be expected in the context of the above views.
Australia's cohort of high net wealth individuals continues to rank among the largest globally, sitting in 10th spot in 2018, despite falling one spot since 2017, according to the Capgemini World Wealth Report 2019.
Driven by a slowing global economy, trade tensions between the US and China and a slump in equity markets, global HNWI numbers snapped a seven-year winning streak last year.
The Asia Pacific region accounted for 50 per cent of the 2018 decline in global wealth, led by China, which comprised 25 per cent of the fall.
HNWI population by country 2017-2018
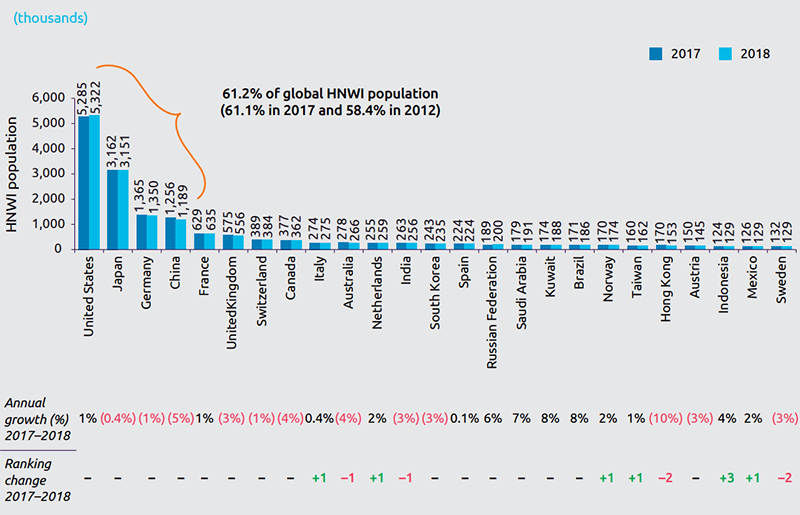
Source: Capgemini
Europe was responsible for about 24 per cent of the US$2 trillion ($2.86 trillion) decline in global HNWI wealth.
Hong Hong slipped two spots to 21st position because of corrections in property prices and the stock market, originating from the slowdown in China.
HNWI asset allocation shifted significantly, with cash becoming the largest asset class of the first quarter of 2019. Investors also adopted an increased focus on alternative investments in response to more volatile share markets, the Capgemini report found.