State of the markets Q4 2020: our analysis in 5 charts
Markets around the world have been on the road to recovery after suffering the devastating effects of the coronavirus pandemic in the first quarter.
The 2019 global returns map was an investor's dream, with most countries delivering above 20 per cent. In a sharp reversal, the current one-year trailing returns are negative for most countries.
China, despite having been the epicenter of the highly infectious coronavirus, has also experienced the most significant rebound, with a 27.7 per cent one-year return. This is in stark contrast with more commodity-dependent economies such as Australia, Canada, and South American countries, whose returns have suffered.
1-year trailing returns of Morningstar country indexes in base currency by percentage
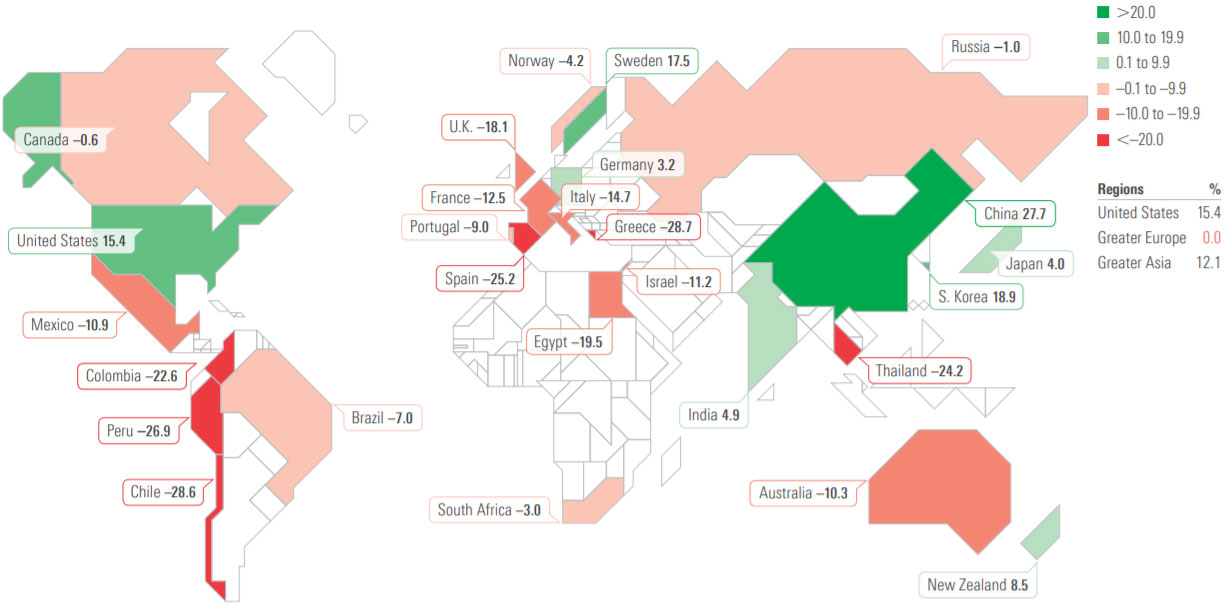
Emerging Asia, where it all started, posted the highest one-year return, driven mainly by China's recovery. The UK fared the worst among developed markets in terms of trailing one-year returns. The Brexit transition period ends this year, and companies have been struggling to adapt to a life outside of the European Union. Despite a weak dollar, which usually benefits emerging-markets assets, Latin America and Eastern Europe were the only two regions to record negative third-quarter returns.
Interest rates remained near historic lows in the third quarter, with accomodative Federal Reserve policy likely to persist for the next couple of years.
Every quarter, Morningstar's quantitative research team reviews the most recent global market trends and evaluates the performance of individual asset classes. We then share our findings in the Morningstar Markets Observer, a publication that can help you set appropriate risk and return expectations for your portfolio.
Here are some highlights from our latest quarterly market commentary.
US Sector Performance
While the US market recovered overall, there are large disparities between the underlying equity sectors. Consumer cyclical and technology were the best performers, as stuck-at-home consumers ramped up their online shopping and tech device usage. Decreasing demand drove oil prices down and hurt energy stocks. Real estate and utilities also posted negative one-year returns since offices and factories (the largest tenants and consumers of utilities) have been closed or running at limited capacity.
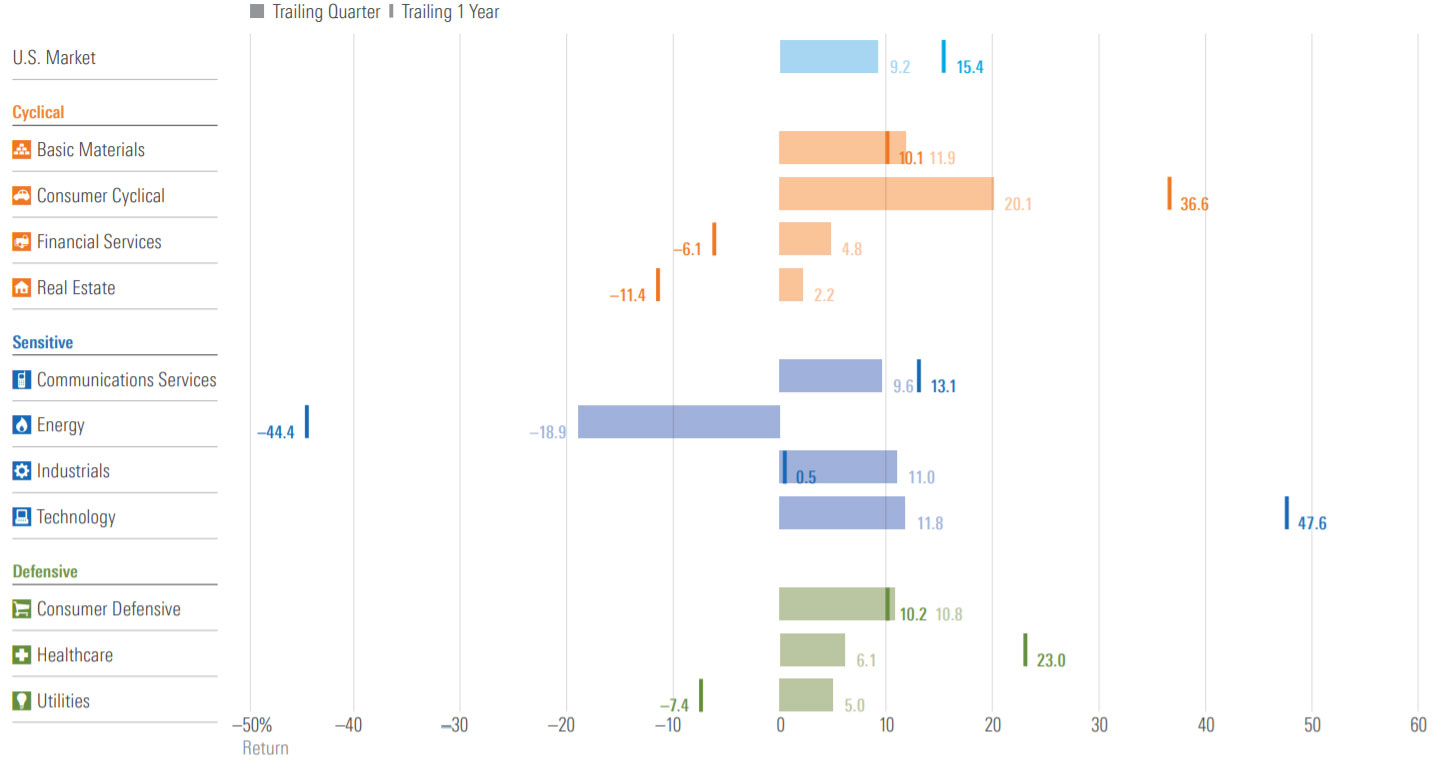
(Click to enlarge) Source: Morningstar Sector Indexes. Data as of September 30, 2020.
Technology is gaining ground in the S&P 500
During the dot-com bubble, from 1995 to 2000, the technology sector hit its peak weight in the S&P 500, climbing from 10 per cent to 33 per cent of the index during this time. It
dropped to 15 per cent shortly after, in 2001.
Although not at its previous height, the sector has been slowly gaining ground, weighing in at almost 25 per cent today. Given current conditions, with everyone stuck at home and heavily dependent on tech devices, this trend has the potential to accelerate even more going forward.
S&P 500 sector weights
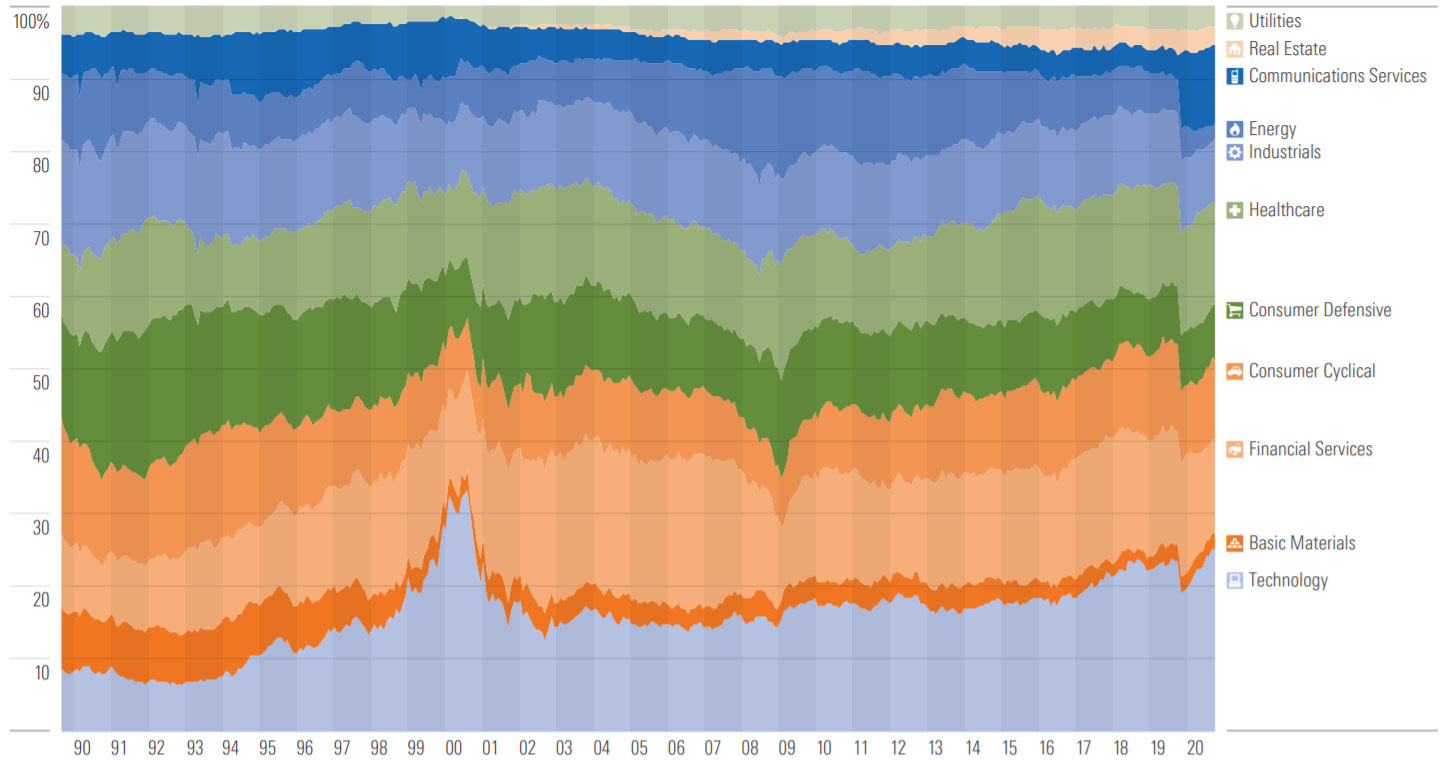
(Click to enlarge) Source: Morningstar Direct. Data as of September 30, 2020.
US companies with more intangible assets per employee outperformed this year
This measure is derived from multiplying a company’s market cap by its intangible-to-total asset ratio and further dividing this by its number of employees. Markets have rewarded companies with the highest intangible-assets-to-employee ratio (quintile 1) with an average 9.8 per cent return year-to-date. In contrast, companies with the lowest such ratio (quintile 5) lost a staggering 24.3 per cent on average. This reflects the dominance of tech and similar firms that don’t rely on physical assets or large workforces.
S&P 500 stock performance based on market value of intangible assets per employee

(Click to enlarge) Source: Morningstar equity data. Sarah Ponczek, “Stock Market Warns Workers That They’re the Problem for Business,” Bloomberg.com (Bloomberg, August 25, 2020). Data as of September 30, 2020.
Can the US economically distance from China?
Both the Trump and Biden campaigns have proposed reducing economic ties with China. US bilateral trade flow with China is lower than with other major trade partners, though China’s importance is more prominent in terms of advanced technology products. Likewise, direct investment by US companies in China and Chinese companies’ assets in the US are very small compared with other regions. China is certainly an important economic partner but is far from the most important.
Total trade flows in 2019 (exports + imports, USD)
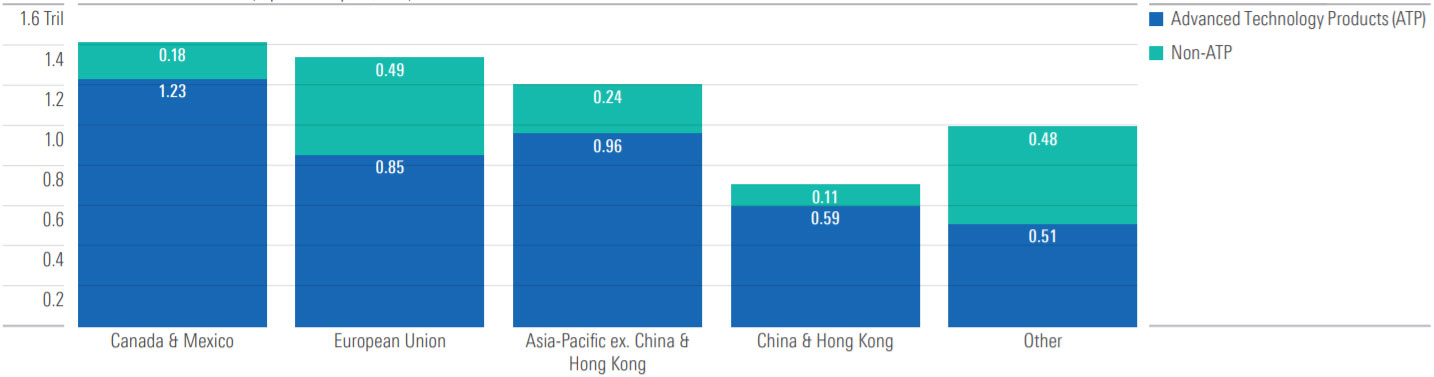
(Click to enlarge) Source: Bureau of Economic Analysis, Census Bureau. Data as of September 30, 2020