Morningstar Fixed Income Style Box Methodology
The model for the fixed income style box is based on the two pillars of fixed-income performance: interest-rate sensitivity and credit quality.
Introduction
The Morningstar Style Box was introduced in 1992 to help investors and advisors determine the investment style of a fund. Different investment styles often have different levels of risk and lead to differences in returns. Therefore, it is crucial that investors understand style and have a tool to measure their style exposure. The updated Morningstar Style Box provides an intuitive visual representation of style that helps investors build better portfolios and monitor them more accurately.
Morningstar classifies bond funds in its style box based on their sensitivity to interest rate as limited, moderate and extensive measured by the average effective duration of the fund's holdings; and their average credit quality as high, medium, or low based on letter (or alphanumeric) credit ratings of bond holdings by third party credit rating agencies. The nine possible combinations of these characteristics correspond to the nine squares of the Morningstar Style Box—quality is displayed along the vertical axis and sensitivity to interest rate along the horizontal axis.
Fixed Income Style
Overview
The model for the fixed income style box is based on the two pillars of fixed-income performance: interest-rate sensitivity and credit quality. As depicted in the image below the three interest sensitivity groups are limited, moderate and extensive and the three credit quality groups are high, medium and low. These groupings display a portfolio's effective duration and third party credit ratings to provide an overall representation of the fund's risk orientation given the sensitivity to interest rate and credit rating of bonds in the portfolio.
Horizontal Axis: Interest-rate Sensitivity
The horizontal axis focuses on interest-rate sensitivity as measured by the bond's portfolio effective duration.
Prior to October 2009, US taxable-bond funds with durations of 3.5 years or less were considered short-term (having limited sensitivity to interest rate change); more than 3.5 years but less than 6 years; intermediate term (having moderate sensitivity to interest rate change); and more than 6 years, longer term (having extensive sensitivity to interest rate change). In October 2009, Morningstar moved from the aforementioned static breakpoints to dynamic breakpoints.
On a monthly basis Morningstar calculates duration breakpoints based around the 3 year effective duration of the Morningstar Core Bond Index (MCBI).
Limited: 25% to 75% of MCBI
Moderate: 75% to 125% of MCBI
Extensive: 125% of MCBI (no upper limit on long term durations)
By using the MCBI as the duration benchmark, Morningstar is letting the effective duration bands to fluctuate in lock-steps with the market which will minimize market-driven style box changes
Non-US taxable-bond funds use static duration breakpoints.
Municipal bond funds with duration of 4.5 years or less qualify as low; more than 4.5 years but less than 7 years, medium; and more than 7 years, high.
Non-US domiciled funds use static duration breakpoints. These thresholds are:
Limited: <= 3.5 years
Moderate: > 3.5 and <= 6 years
Extensive: > 6 years
Vertical Axis: Credit Quality
Historically, Morningstar followed the industry practice of reporting the average credit rating of a bond portfolio by taking a weighted average of ratings based on data provided by the fund company. However, because the default rates increase at an increasing rate between grades (a mathematical property called convexity), this method systematically understated the average default rate of a bond portfolio. For example, for U.S. corporate bonds as of the date of this document, the spread in default rates between CCC and BBB rated bonds was over 21 times that of the default rate spread between BBB and AAA bonds. Yet, the conventional method assumes that these spreads are equal. To see the impact of this, consider a portfolio of 90% AAA bonds and 10% CCC bonds. According to the conventional method, the average credit rating of this portfolio is AA. However, the average default rate for this portfolio is that of BB bonds.
To correct this bias, Morningstar takes the convexity of default rate curves into account when calculating the average credit rating of a portfolio. The first step is to map the grades of a portfolio's constituents into relative default rates using a convex curve. Next, average the resulting default rates (rather than the grades) to come up with an average default rate for the portfolio. Finally, using the same convex curve Morningstar maps the resulting average default rate back into a grade. For example, a portfolio of 90% AAA bonds and 10% CCC bonds will have an average credit rating of BB under this new methodology.
Independent research confirms that the arithmetic average credit rating of a bond portfolio systematically understates the credit risk and that a more meaningful measure would be to average the default probabilities associated with each letter grade and then use the convex curve that relates the numerical representation of the letter grades to default probability to assign a letter or alphanumeric rating to the portfolio. This procedure is detailed in Appendix A.
Based on following breakpoints Morningstar maps the calculated average asset weighted letter credit rating (see Appendix A) for all portfolios on the vertical axis of the style box:
- "Low" credit quality – where asset weighted average credit rating is less than “BBB-”.
- "Medium" credit quality – where asset weighted average credit rating is less than “AA-”, but greater or equal to “BBB-”.
- "High" credit quality – where asset weighted average credit rating is “AA-”” and higher.
Source of Data
The data which drives the fixed income style box is surveyed from fund companies. Morningstar asks fund companies to send the following information on a monthly or quarterly basis for each of their fixed income or allocation funds.
Credit Quality
Each fixed income security and cash instruments in a fund are assigned to one of the following eight categories for the credit quality calculations. The percentages for assets in that letter rating level as a percent of all fixed income and cash assets.
Letter rating data provided to Morningstar in one of the first seven categories (AAA through below B) only reflects letter ratings assigned by one of the Nationally Recognized Statistical Rating Organization (NRSRO). So-called internal or manger-derived, alphanumeric credit ratings are not to be included in those categories: rather, bonds not rated by an NRSRO are included in the not rated (NR) category.
Morningstar is sensitive to the reality that some vendors use Moody’s Investor Services alphanumeric ratings rather than or in addition to S&P letter ratings classification. Below is a chart showing the equivalent Moody’s alphanumeric rating class for each S&P letter rating class.
Morningstar prefers that bonds be classified according to the Barclays Capital Family of Indices ratings rules when ratings are available from all three rating agencies (i.e. use the middle rating of Moody’s, S&P, and Fitch after dropping the highest and lowest available ratings); if only two rating agencies rate a security then the lowest rating should be used; if only one agency rates a security then that rating can be used; if there is a security with no rating that security should go into Not Rated.
Average Effective Duration
Morningstar asks fund companies to calculate and send average effective duration (also known as “option adjusted duration”) for each of their fixed income or allocation funds. We ask for effective duration because the measure gives better estimation of how the price of bonds with embedded options, which are common in many mutual funds, will change as a result of changes in interest rates.
Effective duration takes into account expected mortgage prepayment or the likelihood that embedded options will be exercised if a fund holds futures, other derivative securities, or other funds as assets, the aggregate effective duration should include the weighted impact of those exposures. Standard practice for calculating this data point requires determination of a security’s option-adjusted spread, including the use of option models or Monte Carlo simulation, as well as interest-rate scenario testing Morningstar requests that the fund only report data in this field that has been specifically labeled effective or option-adjusted duration, or that fund is certain has been calculated in the fashion described.
Morningstar categorizes any fixed instrument with less than one year to maturity as cash for the purposes of calculating a fund’s asset allocation breakdown. These short-term fixed securities and other cash instruments are included in the calculation of effective duration.
Morningstar accepts surveys returned with modified duration (and no effective duration provided) for funds in the municipal and high yield categories. Surveys for all other US bond categories that lack a submission for effective duration will not be accepted.
Appendix A
The first three columns of Table 1 present the letter grades and their respective numerical representations for at the security level used in this methodology. The fourth and fifth columns show the mapping from the numerical representation to letter grades for a portfolio.
Morningstar has found that a good model of default rates for a number of rated bond universes is as follows:
Where
The values of f(.; Θ)are called the relative default rates.
The convexity parameter measures the change in the slope from the AAA-BBB range to the BBB- CCC range, relative to the overall slope of the default rate curve:
Where dbbb is the default rate for BBB bonds (Baa2 on the Moody’s scale).
Morningstar calculated Θ for a number of bond universes using equation [2] and found that 0.9 is a fair representation. Since the methodology requires one convex scale for all bond universes, Morningstar set Θ = 0.9 globally. However, since Morningstar will periodically review the data and could choose another value in the future; Θ is programmed as a parameter that can be readily changed.
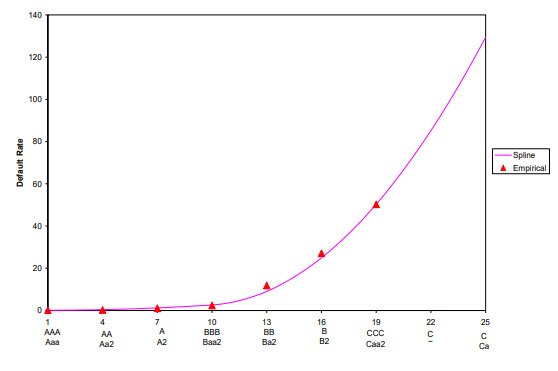
The sixth column of Table 1 shows the relative default rates using Θ = 0.9 and the seventh column shows the resulting fitted default rates using the values of dAAA and dCCC for the corporate bond universe. The eighth column shows the empirical default rates for the corporate universe. Figure 1graphs these empirical default rates and the default rate spline, showing that the spline is a good representation of the default rate curve.
Let y=f(x) denote the value of a quadratic spline at x. Morningstar divides the domain of f(.) into intervals of the form [ xs −1 , xs ], resulting intervals of the range of the form [ ys −1 , ys ].
The values of the endpoints are:
s | xs | ys |
0 | 1 | 0 |
1 | 10 | ½(1- Θ ) |
2 | 19 | 1 |
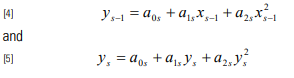
If x falls within the interval [ xs −1 , xs ], the following occurs:
Where a0s , a1s and a2 s are parameters to be determined
To determine the 3 parameters a0s , a1s and a2 s for segment s, 3 equations are needed. Two of the
equations follow from the condition that segment s connect the points (xs−1 , ys−1 ) and (xs , ys ).
Hence:
The third condition follows from the condition that the f(.) be differentiable everywhere on the interval [ xs −1 , xs ]. Suppose for the moment that the value of y's−1= f ' (xs−1) is known. Hence,
Solving equations [4],[5] and [6] for a0s , a1s and a2 s , we have:
We can then calculate
Let the numerical representation of a letter grade be x and the default probability be y. The 2 intervals for x are [1, 10] and [10, 19], representing AAA-BBB and BBB-CCC respectively. Since the default probability curve is flat near AAA, set y'0 = 0. With s=1, use equations, [7], [8] and [9] to find a0s, a1s and a2s and equation [10] to calculate y's. This process is then repeated for s=2
Table 1: Credit Grades and Default Rates (with Corporate Bond Example)
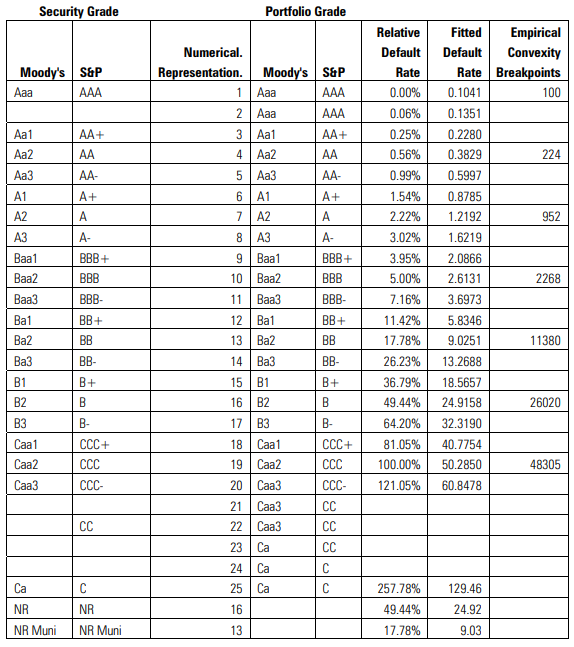
Figure 1: Default Probability Curves
Bond Portfolios
Given a portfolio of fixed income securities, let
The average default probability of the portfolio is
To assign a portfolio letter grade, first calculate f1 (yp). To do this, first identify which segment of the spline yp falls into (s= 1 for [ y0 , y1 ] or s=2 for [ y1 , y2 ]). Then calculate as follows:
Round xp to the nearest integer and use the third, fourth, and fifth columns of Table 1 to assign letter grades.
In terms of xp, the vertical axis of the style box are:
A - "Low" credit quality – xp > 11
B - "Medium" credit quality – 5 < xp ≤ 11
C - "High" credit quality – xp ≤ 5