The US tech sector may be in bubble territory again
The US tech sector looks frothy, yet broader markets don't seem expensive and some other sectors seem downright cheap.

Mentioned: Apple Inc (AAPL), Amazon.com Inc (AMZ), Meta Platforms Inc (META), Alphabet Inc (GOOG), Microsoft Corp (MSFT), NVIDIA Corp (NVDA), Tesla Inc (TSLA)
“There are these two young fish swimming along and they happen to meet an older fish swimming the other way, who nods at them and says, “Morning, boys. How’s the water?”
And the two young fish swim on for a bit, and then eventually one of them looks over at the other and goes, “What the hell is water?””
The late, great US novelist, David Foster Wallace, included this parable in a speech entitled, ‘This is water’ at a US college commencement address in 2005. It went viral as much for its poetry as its brutal honesty.
The point of the parable is that the most important and obvious realities are often the hardest ones to see.
Markets are missing the obvious
There’s a parallel to financial markets today as I see an obvious reality that the US tech sector is back in bubble territory again, yet few others are talking about it.
It’s odd how this has come about. Last year, everyone seemed to have recognized that the prices of many assets had become ludicrous and that their subsequent pummeling was long overdue. However, a number of these same assets have come roaring back to life this year and there’s been barely a peep.
Bitcoin hasn’t not nearly got the same attention and it’s rocketed 135% in 2023. Tech stocks in the US aren’t far behind. Tech bellwether, the NASDAQ, is up a blistering 45% year-to-date. Of the S&P 500, seven stocks aka ‘The Magnificent Seven’ have risen 68% this year, while the remaining 493 stocks in the index are just 2.5% higher.
Here are ‘The Magnificent Seven’ total returns this year:
Nvidia (NAS: NVDA) +230%
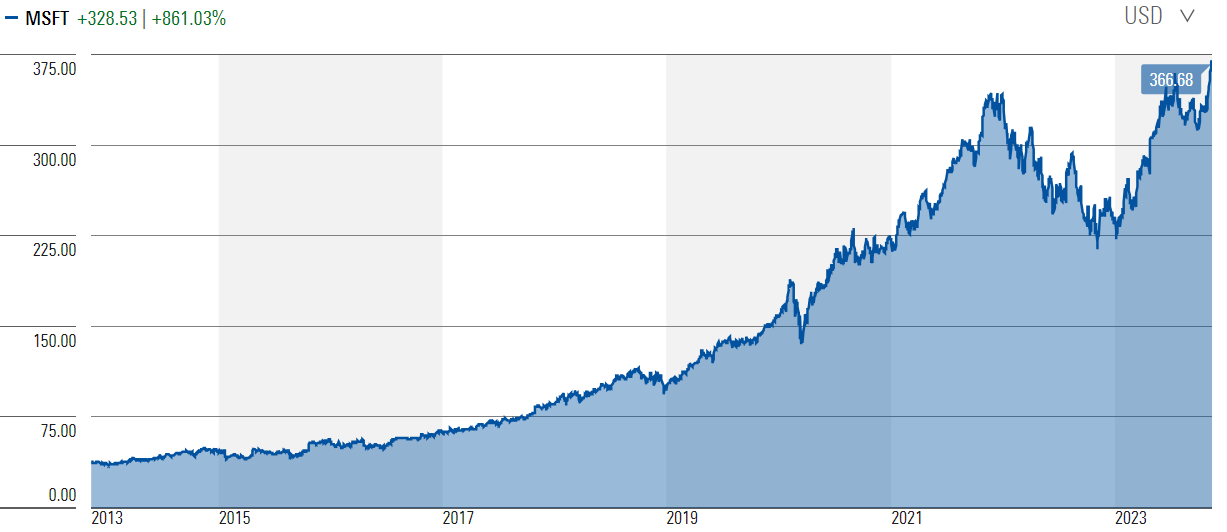
Microsoft (NAS: MSFT) +55%
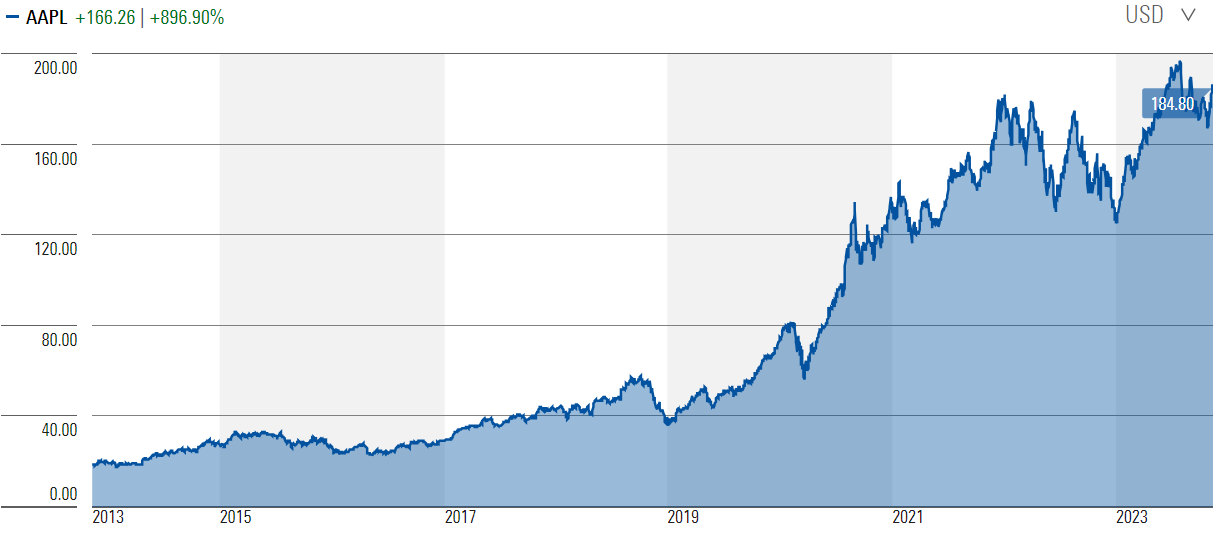
Apple (NAS: AAPL) +44%
Meta (NAS: META) +171%
Alphabet (NAS: GOOGL) +50%
Amazon (NAS: AMZN) +70%
Tesla (NAS: TSLA) +74%
At first glance, what’s staggering is how much the prices of these mega-cap companies have moved in one year. Apple and Microsoft are worth US$2.9 trillion and US2.7 trillion, and they’re up 44% and 55% respectively this year. For Microsoft, the market believes that the company is worth around US$950 billion more now than it was at the start of the year. Even with the hype around artificial intelligence, business values moving around this much are difficult to fathom.
Though, perhaps not. Let’s look at the trailing price-to-earnings (PER) multiples of the seven stocks, based on Morningstar estimates:
Nvidia 117x
Microsoft 36x
Apple 30x
Meta 29x
Alphabet 25x
Amazon 75x
Tesla 72x
Simple average 55x
The simple average multiple of 55x compares to the S&P 500’s 24x, a premium of 129%.
Of course, some of the stocks above are set for stellar growth over the next few years. Nvidia, riding the AI boom, is a standout here.
Yet other stocks with high multiples attached are struggling to grow. Apple is one. Another is Tesla where Morningstar expects earnings to shrink this year as competition heats up in the electric vehicle space. And Alphabet faces a serious structural threat to its dominant search engine business from AI.
Have earnings driven stellar tech returns?
I thought it would be a worthwhile exercise to look at how much earnings growth has contributed to the rise in share prices for some of these stocks. For instance, Microsoft’s stock has risen by 861% over the past decade. That’s excluding dividends. Including those, and the stock has compounded at 26% per annum. A stellar performance.
How much of that performance was driven by earnings? Well, earnings per share over that period increased at a compound annual growth rate (CAGR) of 14% on revenue which grew at an 11% CAGR clip. In simple terms, earnings accounted for a little over 50% of the Microsoft’s price rise over the 10 years. The remaining 50% or so came from expansion in the multiple attached to the stock.
Back in 2013, Microsoft was considered a stodgy dinosaur and it was valued as such, bottoming with a trailing PER of 13x. How times have changed.
Source: Morningstar
Apple is another case study. Over the past 10 years, the stock is up 896%. Including dividends, it’s compounded at 26% per annum, the same as Microsoft.
Earnings per share over that period have compounded at 15.8% per annum. A big chunk of that return has come from share buybacks as operating earnings were up only 8.8% a year over the decade.
Earnings accounted for around 61% of the total return over 10 years, with the remainder attributable to an increase in the earnings multiple applied to the stock.
Source: Morningstar
S&P 500 tech weighting also flashes warning sign
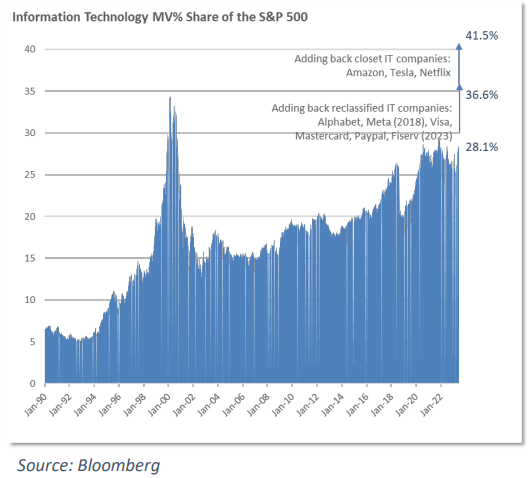
It’s not only the prices of large cap tech stocks that should concern investors. IT’s weighting in the S&P 500 provides further evidence of irrational exuberance in the sector.
On the face of it, the tech sector’s weighting of 28% in the S&P 500 looks high.
But that doesn’t tell the full story. There are companies that should be part of the tech sector but aren’t. For example, Amazon and Telsa are classified as consumer discretionary when they’re arguably not. Amazon’s cloud business generates 107% of operating profits, which should make it an IT company. In case you’re wondering, Amazon’s online retail business doesn’t make any money (those deliveries are loss makers, after all). Netflix, Alphabet, and Meta are classified as communication companies when they clearly shouldn’t be.
If you include these companies in the tech sector, the true weighting of IT in the S&P 500 is closer to 41%, which is well above the peak of 35% reached in 2000.
Crowding into tech has created opportunities in other sectors
Like in 2000, an extraordinary amount of money has found its way into the tech sector at the expense of the rest of the market, leaving some sectors looking cheap. And like back then, these sectors may perform well even if tech stocks pull back hard.
The energy sector appears the standout in this regard. In the US, the sector is down 2% versus the S&P 500’s 18% gain this year. And energy looks inexpensive on almost every valuation metric.
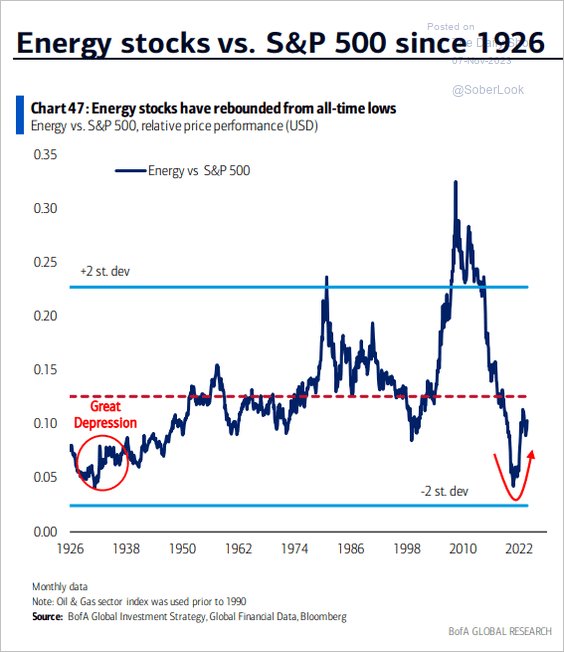
Energy stocks have the potential to be what tobacco stocks were over the past century. The tobacco sector in the US outperformed all other sectors over the past century. On the face of it, this seems strange. After all, tobacco has been a dying industry for decades. That’s only been part of the story, though.
Increased regulations, tax hikes, and numerous lawsuits have driven companies out of the sector, leaving only a few large players left. With this consolidation has come immense pricing power for those companies which remain. Increased tobacco pricing has been able to offset reduced product demand.
Throw in almost perpetually low valuations for the tobacco sector providing opportunities to buy back stock at cheap prices, and that’s led to incredible long-term returns for shareholders.
The energy sector has similar dynamics to the tobacco sector. Oil and coal demand will likely decline in coming decades. That’s led to large cuts in investment, which is reducing supply. The question is whether supply cuts will outrun demand cuts, and I suspect they will.
There’s also pressure on investors to not invest in oil and coal stocks. Many of these investors are essentially forced sellers of these stocks. That’s making many shares in the sector cheap. Yes, they could be forever cheap, though like tobacco, that paves the way for stock buybacks at inexpensive prices.
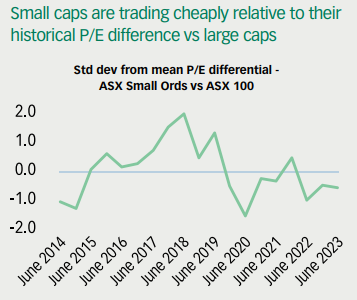
The other opportunity may be in small caps. In the US, small caps are at their lowest level compared to large caps since December 2000.
It’s similar in Australia.
If the US tech sector does stumble at some stage, these types of opportunities may finally get some love from investors.
James Gruber is an assistant editor at Firstlinks and Morningstar.com.au