Morningstar runs the numbers
We take a numerical look through this week's Morningstar research. Plus, our most popular articles and videos for the week ended 22 November.

30%
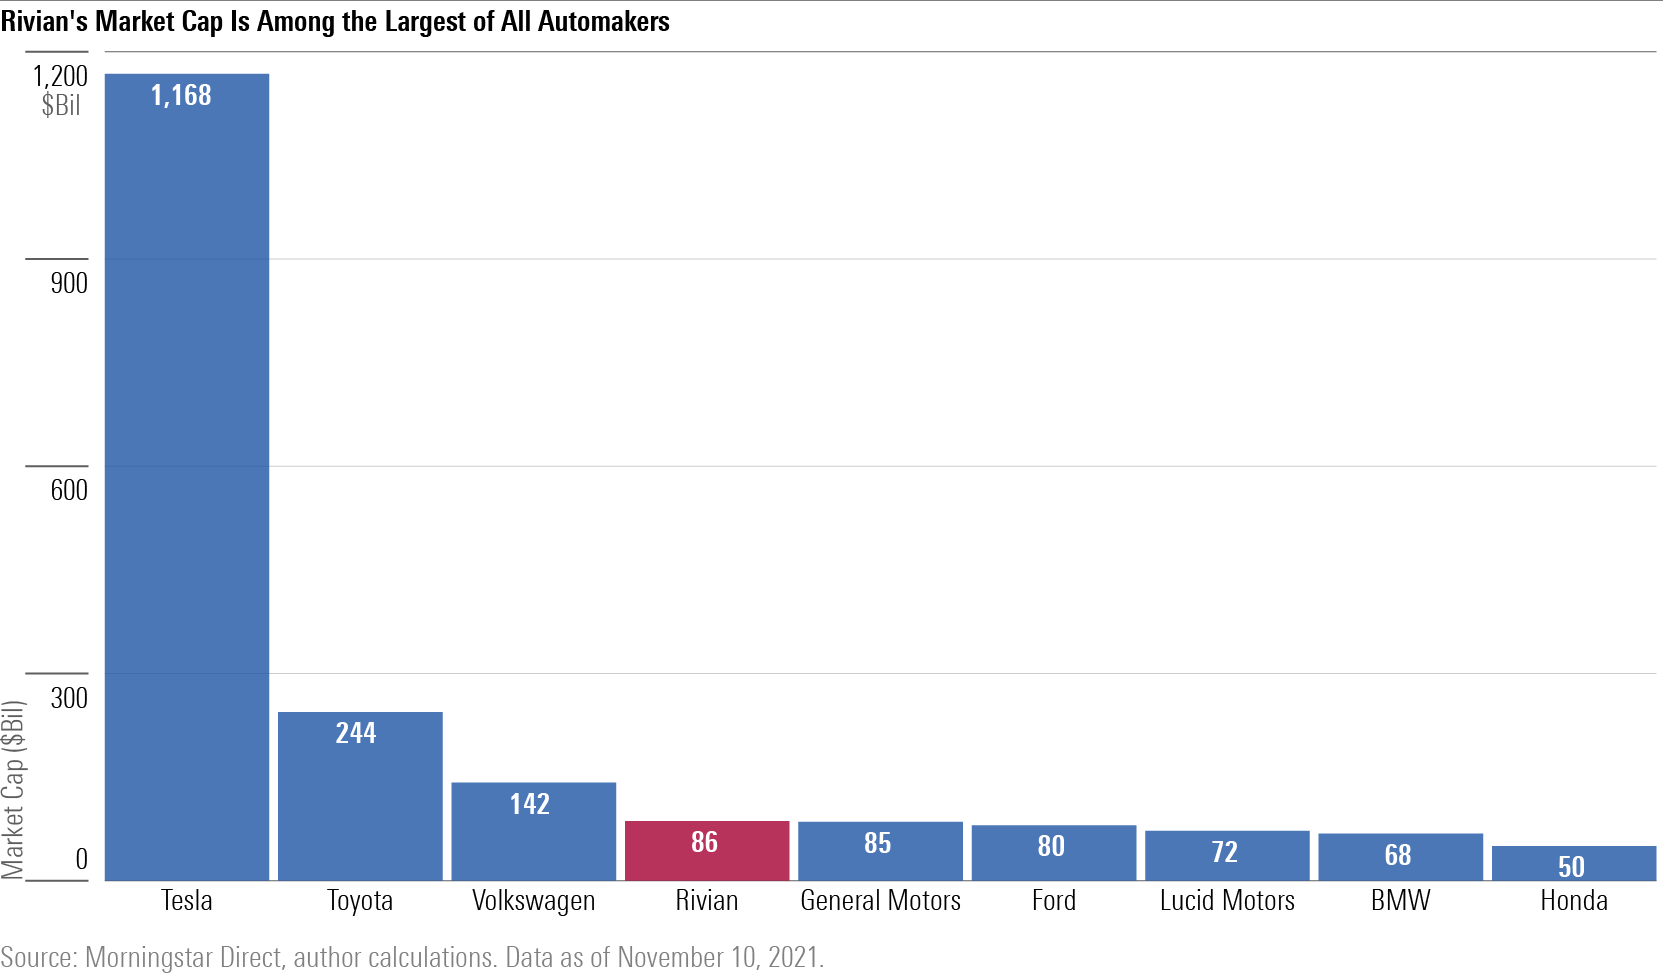
Electric vehicle maker Rivian jumped nearly 30% on its first day of trading, writes Margaret Giles in her analysis of what follows hot IPOs: "Rivian Automotive has had a supercharged debut as a stock, racing more than 50% above its initial public offering price in its first two days, including a nearly 30% pop on day one. With this surge in its stock, the EV manufacturer joins the ranks of IPOs that have seen big rallies out of the chute. Having raised nearly $12 billion through the stock offering, the market is attaching a value to the company roughly equal to that of Ford and General Motors—even though it has just begun producing vehicles for sale. So for investors wondering whether to chase the rally, the history of IPOs such as Rivian’s is important to consider.”
26th
With Australia ranked 26 out of 26 when it comes to portfolio disclosure laws, most local fund investors won't know what's in their portfolios, writes Emma Rapaport: “An annual study undertaken by Morningstar ranked Australia dead last out of 26 countries on managed funds disclosures. Investors in the United States, Canada, the United Kingdom can go on the websites of asset managers and see how their money is invested. In India, fixed income portfolios are updated every two weeks. While some Australian super funds have proactively increased transparency about their portfolio holdings in recent years, they are in the minority.”
215%
Warren Buffett’s preferred valuation measure hit a record 215% this year and Graham Hand asks are we in a bubble or is this time really different? “Warren Buffett calls this ratio “probably the best single measure of where valuations stand at any given moment”. With the current market value of US stocks reaching US$50.8 trillion versus US GDP of around US$23.7 trillion, the ratio has hit a record high of 215%. Prior to the year 2000, it was normally around 50%, and even allowing for the fall in interest rates and a rising trendline, a number of 120% looks fairly valued. At 2.4 standard deviations above historical average, the market is testing those who look for value signals. But is this time different?.”
2%
Distributions can be more than 2% higher between the ETF and managed fund versions of the same Vanguard funds, leading to higher taxes for investors, I write: “Differences range from a few tenths of a percent to more than two. For example, the Vanguard Australian Shares Index Fund had an annualised distribution of 4.62% over the past five years, slightly higher than the 4.19% from the ETF version. But that difference jumps to more than 2% for the ETF and unlisted versions of Vanguard International Shares over the same period. A spokesperson for Vanguard acknowledged the difference in distributions between these funds is due to differences in the treatment of capital gains.”
Charts from last week
Rivian's market capitalisation tops General Motors and Ford despite only a handful of trucks in production (here)
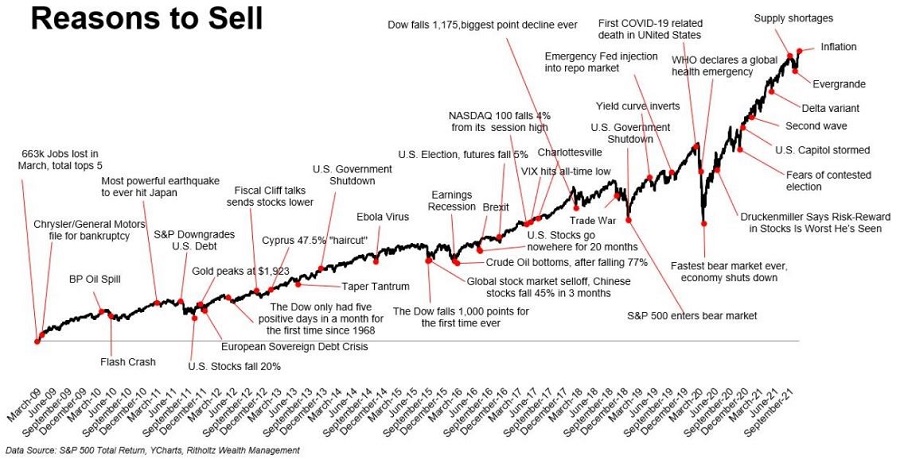
Markets have shrugged off doomsayers and risen steadily since the Global Financial Crisis (here)