
The Great Debate Pt 2: Houses pip equities but apartments lag over the long run
Mortgage leverage is powerful but needs steady price growth to be decisive.
Mentioned: Stt Strt SPDR S&P/ASX 200 ETF (STW)
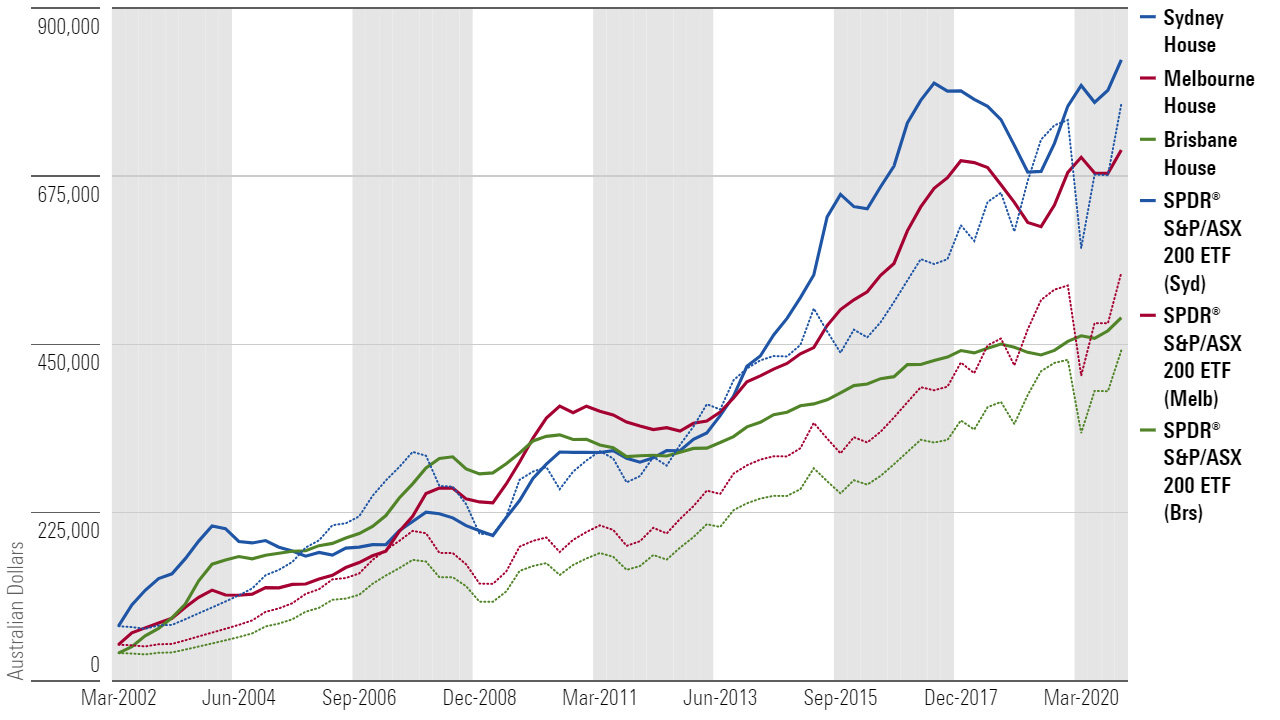
Houses in the east coast capital cities edge out an ASX 200 ETF over the long run but returns on apartments lag.
Buying the median Melbourne house in 2002 with a 20 per cent deposit would have left an investor with $709,933 in 2020, above the $545,929 had they chosen equities and renting. But the buyer of an apartment in the same city, with the same deposit, would be looking at $402,786, well under the $506,064 had they chosen equities and renting.
Choosing the median house in Sydney and Brisbane would also have outpaced the SPDR® S&P/ASX 200 ETF (ASX:STW), although the difference in return was smaller. Apartments in all capital cities returned significantly less than choosing equities and renting.
The leverage in a mortgage boosts returns more than the extra disposable income a renter can add to their equity portfolio, but only when prices are consistently growing; long periods of property price stagnation, such as Sydney’s lull between 2004 and 2012, or Brisbane’s between 2010 and 2016, drag on returns.
These results form part 2 of a Morningstar series on long-term property and equity returns. Part 1 looked at the growth of a deposit over time. Part 2 incorporates mortgage leverage, interest, upkeep, and rent.
The updated model compares the return of a homeowner who bought a capital city property in 2002, with their hypothetical return had they instead opted to rent and used the income to invest in an ASX 200 ETF.
Scroll to the bottom for a detailed methodology.
Overall: property vs. renting and buying an ASX 200 ETF

Source: Morningstar Direct, Australian Bureau of Statistics, Reserve Bank of Australia
*For consistency, rent and upkeep costs are relative to each city and dwelling type.
Melbourne houses lead the east coast
In all three capital cities, the median house was a better purchase relative to the combination of equities and renting.
Sydney may have been in the headlines recently, but Melbourne and Brisbane both had higher percentage returns between 2002 and 2020.
The median house in Melbourne was the clear winner for the homeowner, clocking in a return of 1373 per cent, versus 1033 per cent if they had chosen to rent and invest in equities. In dollar terms the difference would have been $164,004.
The gap was much closer in Sydney and Brisbane.
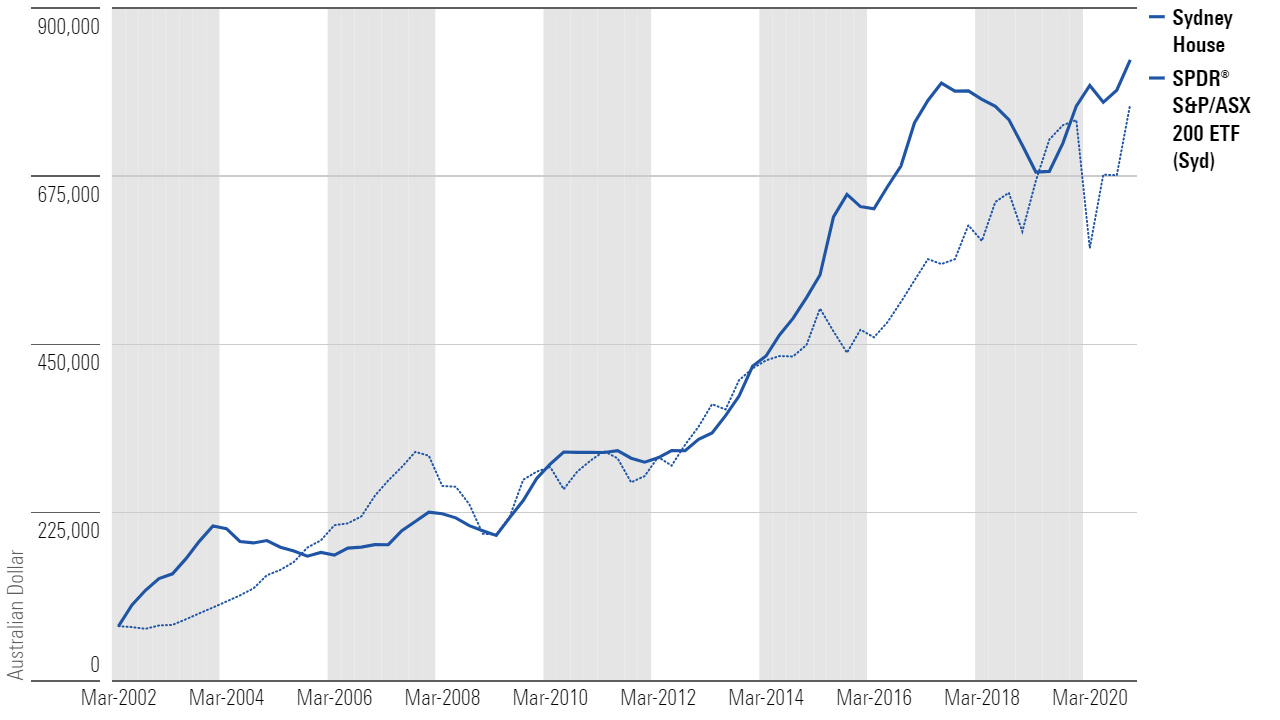
In 2002, if an investor had bought the median Sydney house, with a 20 per cent deposit of $73,000, they would be looking at $830,499 today. If the same investor had put the deposit into STW, and added to it consistently each quarter, they would be looking at $771,176 today.
That’s a difference of $59,323 in favour of housing.
Repeat the same situation again for the median Brisbane house, and the difference would be even smaller at $44,003 in favour of housing.
The difference is partly due to divergent growth rates. The Melbourne house price index rose 241 per cent over the period, compared to 210 per cent for Brisbane, and 174 per cent for Sydney.
Brisbane and Sydney also both experienced multi-year slowdowns in price growth. Between March 2004 and December 2012, Sydney house prices only grew 17 per cent. Brisbane house prices grew 11 per cent between March 2010 and March 2016.
Capital cities: House vs. renting & STW (dotted lines represent STW)

Source: Morningstar Direct, Australian Bureau of Statistics, Reserve Bank of Australia
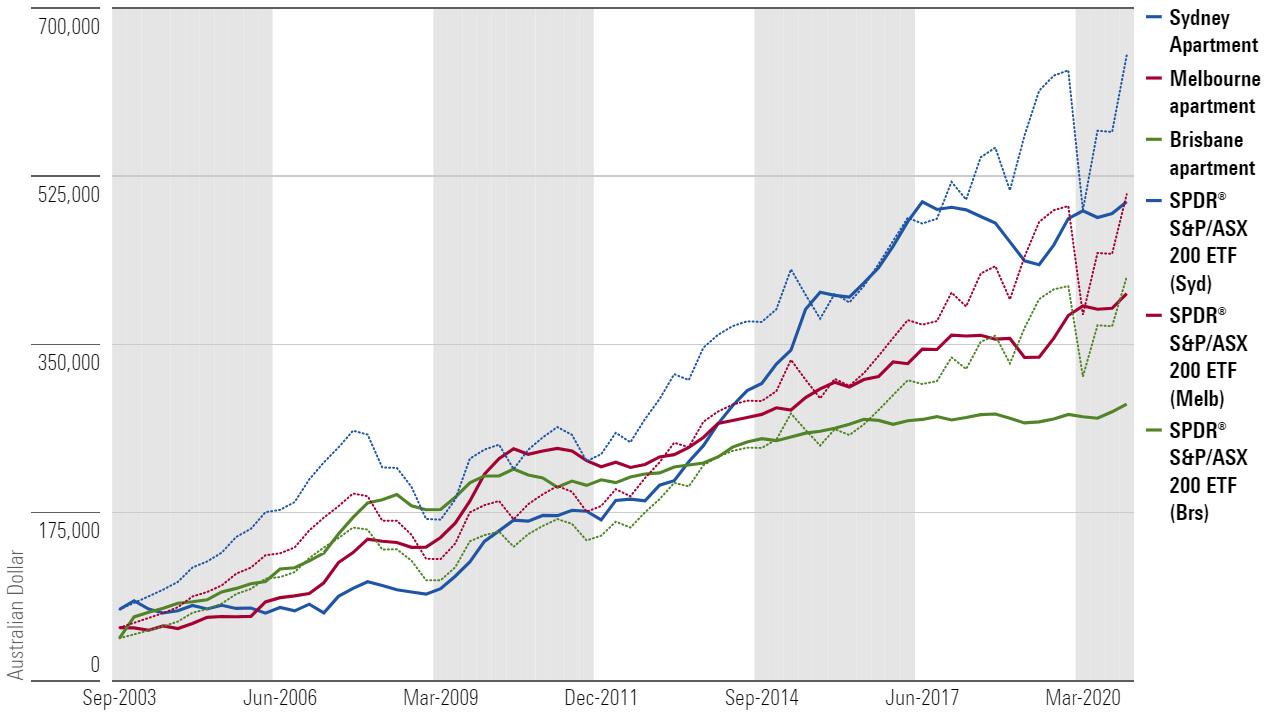
Capital city apartments lag
Choosing to rent and invest in equities trumped buying an apartment in any of the three capital city cities in the period between 2002 and 2020.
Sydney saw the widest difference. Someone who chose to rent and invest inequities would have gained an additional $152,165 versus an apartment owner.
The differences in Brisbane and Melbourne were slightly closer, at $132,363 and 103,278, respectively.
Lower overall growth and periods of price stagnation weighed on apartment returns in all three cities.
Capital cities: Apartments vs. renting & STW (dotted lines represent STW)

Source: Morningstar Direct, Australian Bureau of Statistics, Reserve Bank of Australia
More considerations
Transaction costs, regulatory risk, and leverage
Capital gains taxes reduce the return for equity investors, while the entry costs on a mortgage, such as stamp duty, eat into the initial accumulation for a property investor.
Action from regulators trying to rein in price growth could be a risk for property owners, says David Bassanese, chief economist at BetaShares.
"Probably the property market does face greater regulatory risk over the long run," he says.
"In the short run, if the property market gets too hot, there are macroprudential tools to dampen growth, but there is no obvious tool to dampen the share market."
Whereas accessible leverage was once solely the domain of property buyers, equity investors can now access leverage through equity loans or geared ETFs. Equity loans were once risky for individual investors because of margin calls, whereby a lender demands cash or an asset sale to cover portfolio losses. But there are now products without margin calls. As with a mortgage, any form of leverage exposes the investor to a loss of equity should prices fall.
Returns on houses and equities are riding on record highs. Interest rates are some of the lowest levels in recorded history. Investors should keep in mind that the historical record is full of periods where prices move sideways and interest rates move up.
See part 1 for a further list of considerations.
Sydney house vs. renting & STW (dotted line is STW)

Source: Morningstar Direct, Australian Bureau of Statistics, Reserve Bank of Australia
There are options even if the bank of mum and dad is closed
In 2002, a 20 per cent deposit on the Sydney median house was $73,000. Today it’s closer to $200,000.
At these prices, the property market, especially those areas which tend to experience higher growth, are harder to reach for many would-be homeowners.
But while an inaccessible property market might keep some young investors up at night, they shouldn’t worry. Morningstar’s results suggest that renting and investing in equities is not a bad second option.
Approach
Property owner returns are the difference between the house value and the outstanding loan each quarter. The outstanding loan varies over time as principal payments are made and interest rates change.
To account for rent, interest, and upkeep, I assume the equity investor increases their portfolio equal to the amount they save on mortgage interest and property upkeep, minus rent; [(Mortgage payments + Upkeep) – Rent].
Mortgage payments are calculated using a 30-year loan period and the aggregate variable owner-occupier mortgage rate from the RBA, updated on a quarterly basis. The initial rent value for each example is calculated by multiplying a 4.5 per cent gross rental yield with the median property value. Rent increases each quarter in line with Trimmed Mean Inflation. Upkeep costs are assumed to be 1.5 per cent of property value, as per this RBA research paper.